Non-profit Analytics and Dashboards
Non-profit organizations survive and thrive because of sponsorship, grants, donations, and other community involvement. One of the biggest struggles we’ve seen is how non-profit organizations tell the story of their impact as well as their reach. If you are a director, board member, or fundraiser for a non-profit, you’ve probably asked yourself “How do we secure more funding?” until you’re blue in the face. Having worked with several non-profits to date, we have come up with a few very succinct methods for telling your story through visual analytics.

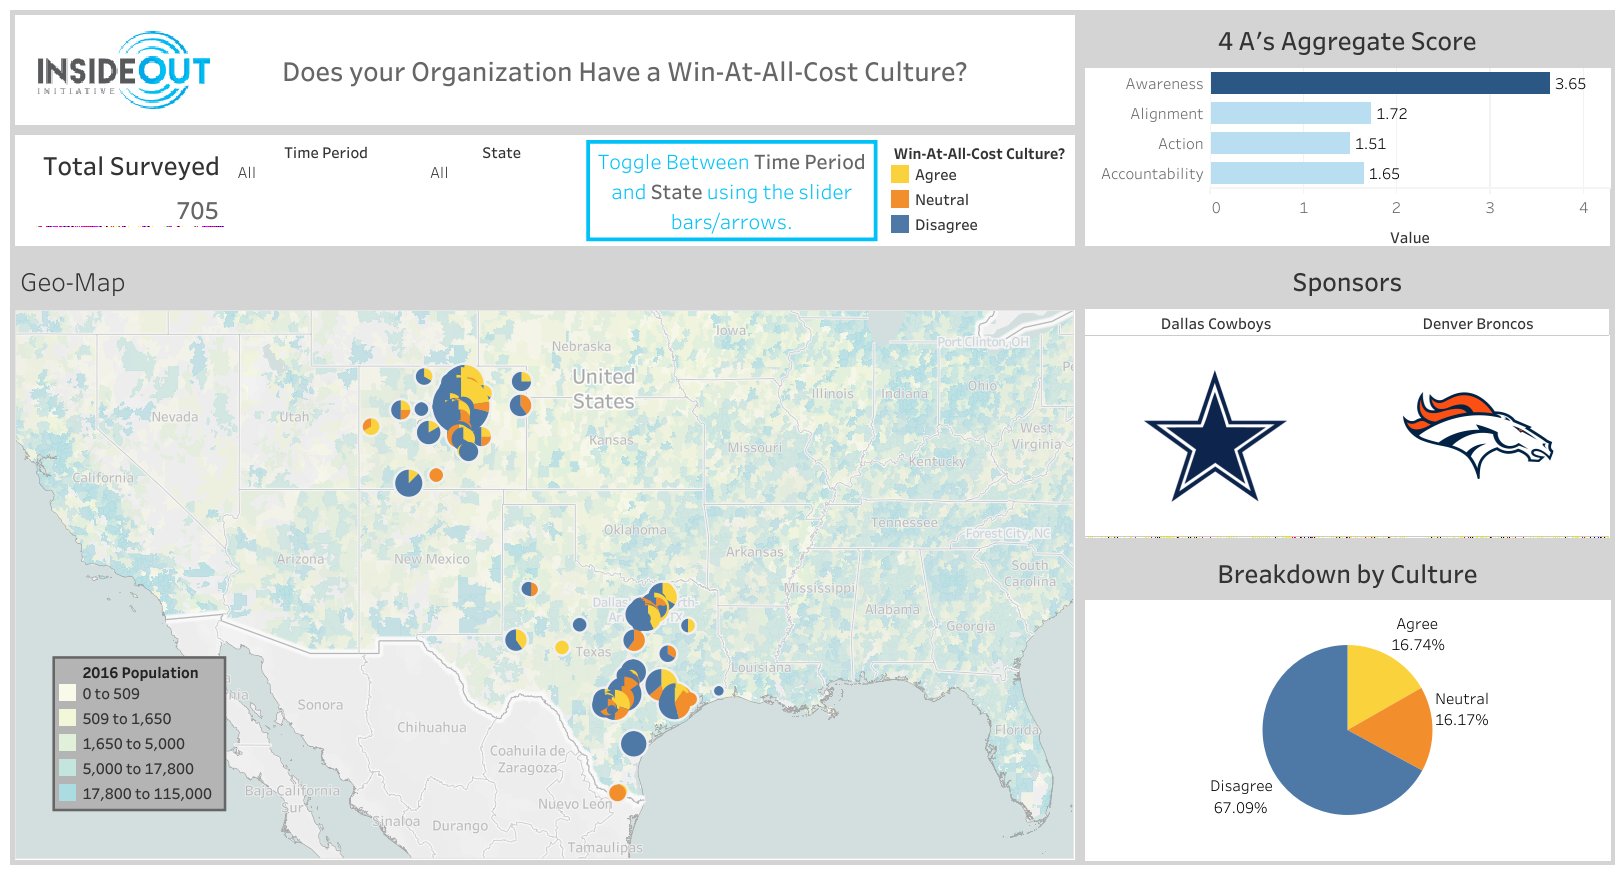
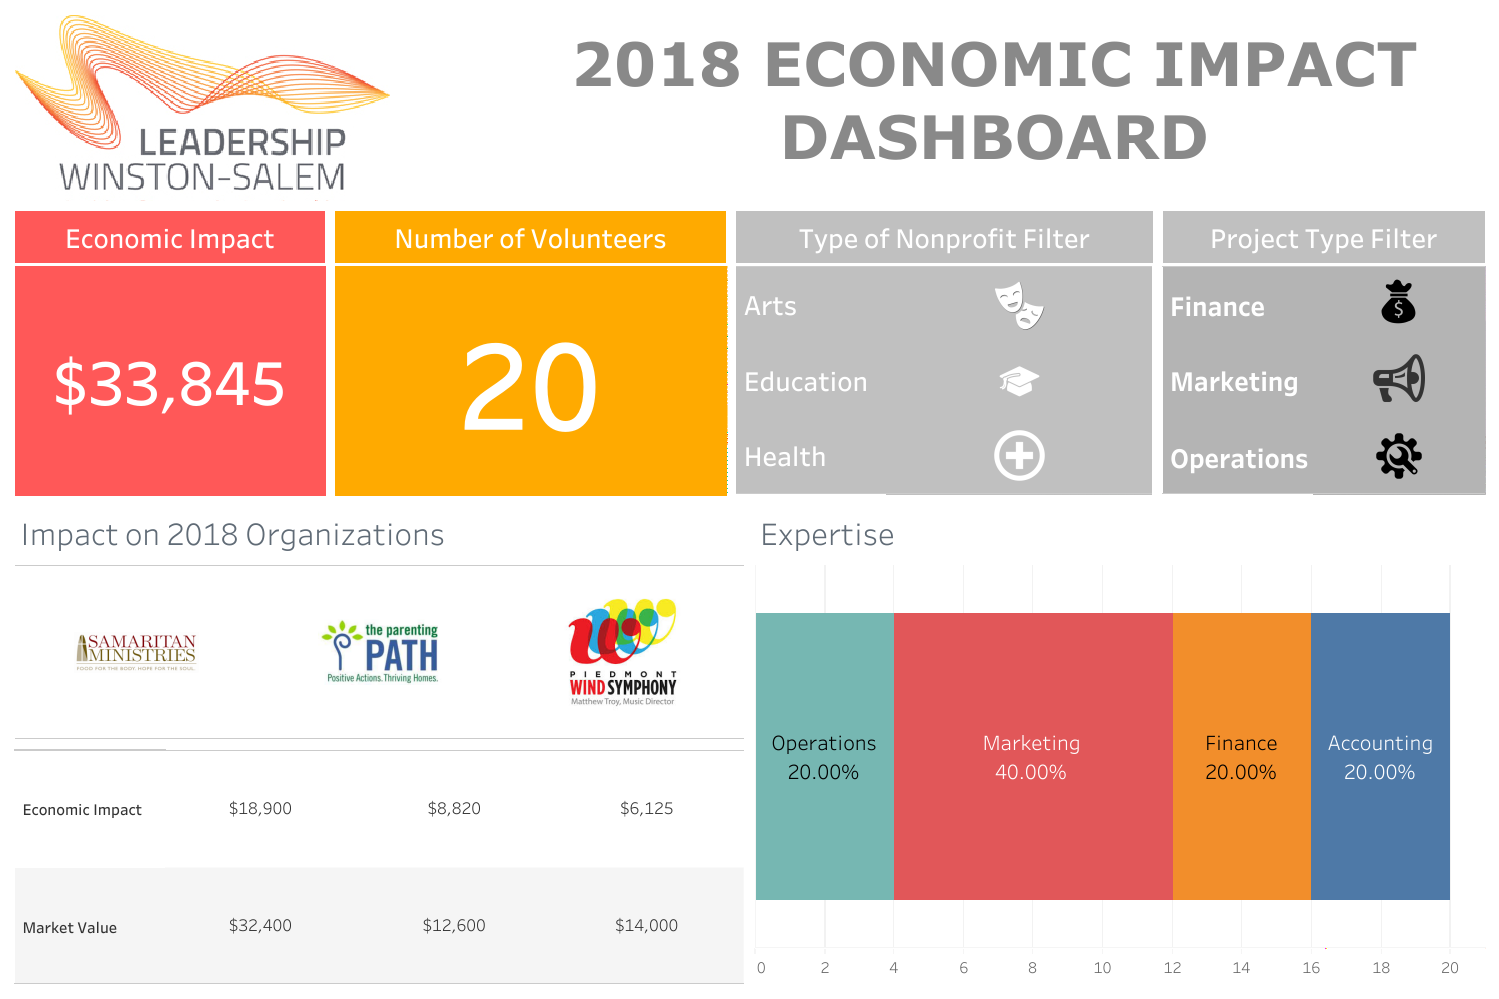
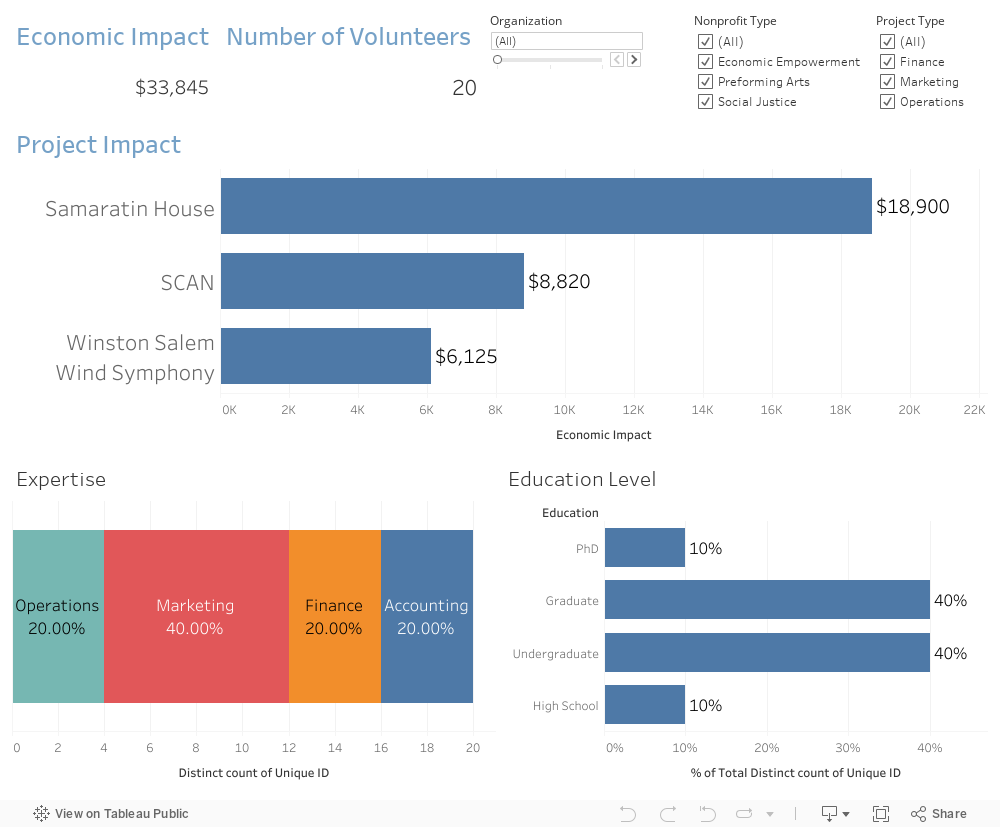
Non-Profit Impact Analysis Dashboards
To the left you’ll see a sample impact analysis dashboard we created for Winston-Salem-based Leadership group as well as the NFL Foundations active participation in shifting attitudes towards a win-at-all-costs mentality. The detailed survey data and supporting visualizations help these organizations quantify the impact of programs on attitudes, community benefit, and effective change on other community groups.
Non-Profit Sponsorship Dashboards
In addition to showing impact on the community to secure grant and other funding, non-profits can harness the power their own member base / community to secure sponsorships with interested parties. Below is an example of a local non-profit tennis program’s members (updated monthly) that shows potential sponsor reach based on which program option they choose.